Semiconductor defect detection
Automatic surface-defect detection on 1.5 cm semiconductor parts for HBM, in production at a Korean manufacturer.
- result
- Inspection time cut by over 90%, shipped defect rate from 10-15% to under 1%
- role
- AI consultant and developer, independent
- stack
- Computer vision, anomaly detection, object detection, on-site deployment
- >90%less inspection time: 30 to 45 min per lot down to 2 to 3 min
- <1%defect rate in shipped parts, down from 10 to 15%
- 96.0%F1 on the final pass / fail decision per part
- 1.5smodel time per part, on one workstation GPU
What changed for the company
| Before | Now | |
|---|---|---|
| Inspected by | Human inspector | Automatic detection |
| Time per lot (9 parts) | 30 to 45 min | 2 to 3 min (over 90% less) |
| Shipped defect rate | 10 to 15% | under 1% |
Problem
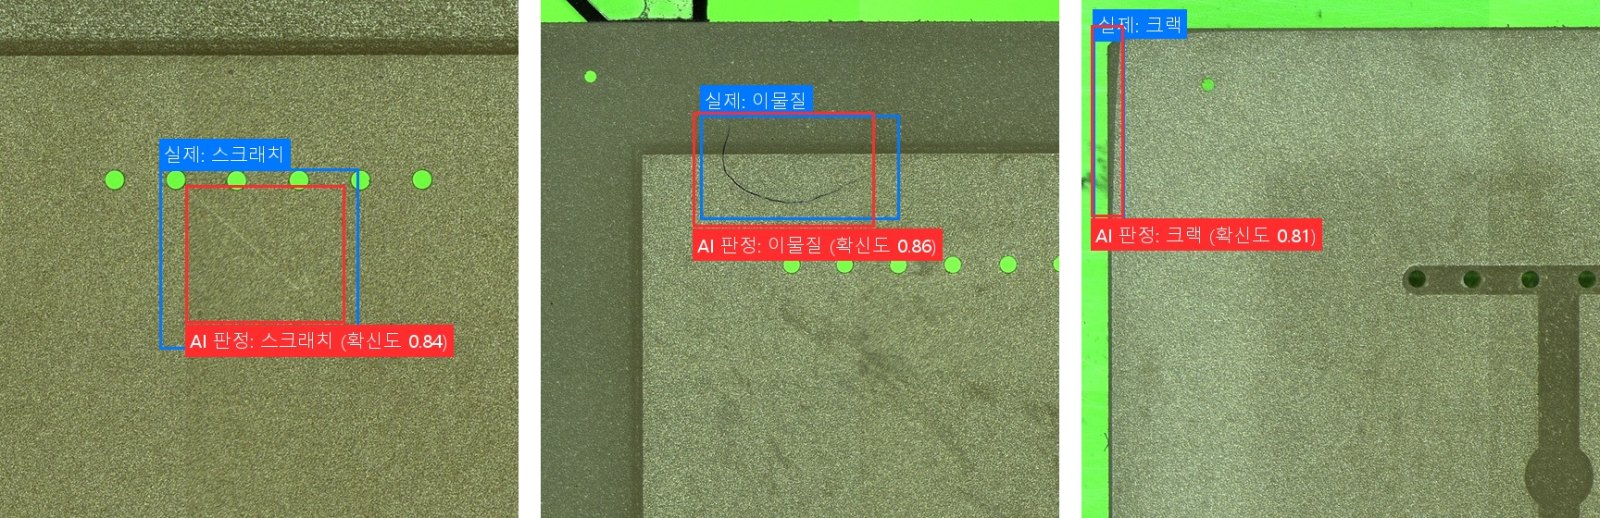
HSCK is a Korean company that makes semiconductor parts for HBM (high-bandwidth memory). Each part is about 1.5 cm x 1.5 cm, and every one is checked for surface defects before shipping. Inspectors did this at a microscope: slow, tiring, and different from one inspector to the next. The defects are scratches, foreign matter and cracks, often only a fraction of a millimetre on a part the size of a fingernail.
Model accuracy
| Metric | Result |
|---|---|
| Pass / fail per part (F1) | 96.0% |
| Defect type, 3 classes (macro-F1) | 90.4% |
| Defects located | 85.8% |
The vision stack
| Stage | Model | Job |
|---|---|---|
| 1. Part score | DINOv3 ViT-B/16, frozen, with LoRA and an attention MIL head, averaged with a semi-supervised patch classifier. Five folds ensembled | One pass / fail score per part. 79% of parts are decided automatically here |
| 2. Gray zone | Logistic re-scoring that adds the detector’s evidence | Parts with an uncertain score get a second look. What stays uncertain (about 21%) goes to the operator |
| 3. Defects | RF-DETR Medium at 1120 px fused with DEIM-D-FINE-L at 960 px (weighted box fusion) | Where the defect is and what type it is |
The design choice that mattered: the system is allowed to say “not sure”. Two thresholds split parts into automatic OK, automatic NG, and a gray zone for a person. That is how it reaches 96% F1 overall without pretending the hard cases are easy.
Data and evaluation protocol
- 748 parts (394 good, 354 defective), 1,496 faces, 996 labelled defects, all collected on site for this project.
- All headline numbers are out-of-fold: 5-fold cross-validation split by part, so no part appears in both training and test.
- Checked again on an independent test set of 232 faces, where the deployed detector located 89.1% of defects at the same false-alarm level.
What I tried and rejected
- A YOLO-family detector: located only 54% of defects on this data, not good enough even as an ensemble member.
- Grounding DINO: its confidence scores were not calibrated, and adding it to the fusion made results worse.
- A pixel-level second inspection of gray-zone parts: the cropped peaks hit the real defect only half the time.
In use on the inspection PC
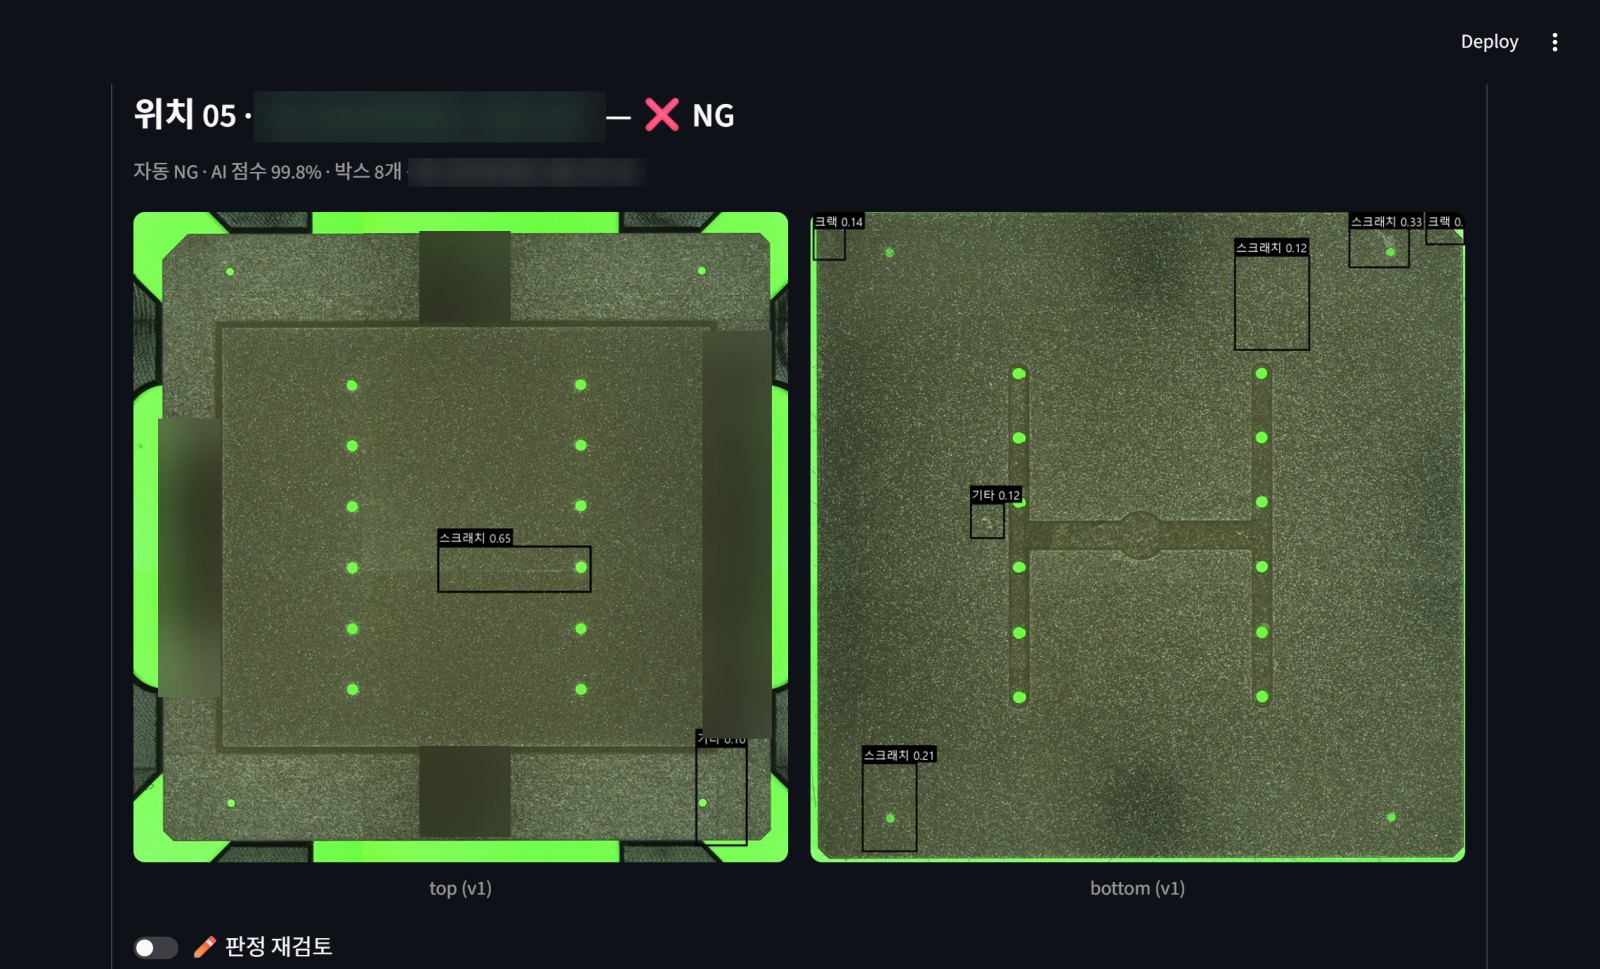
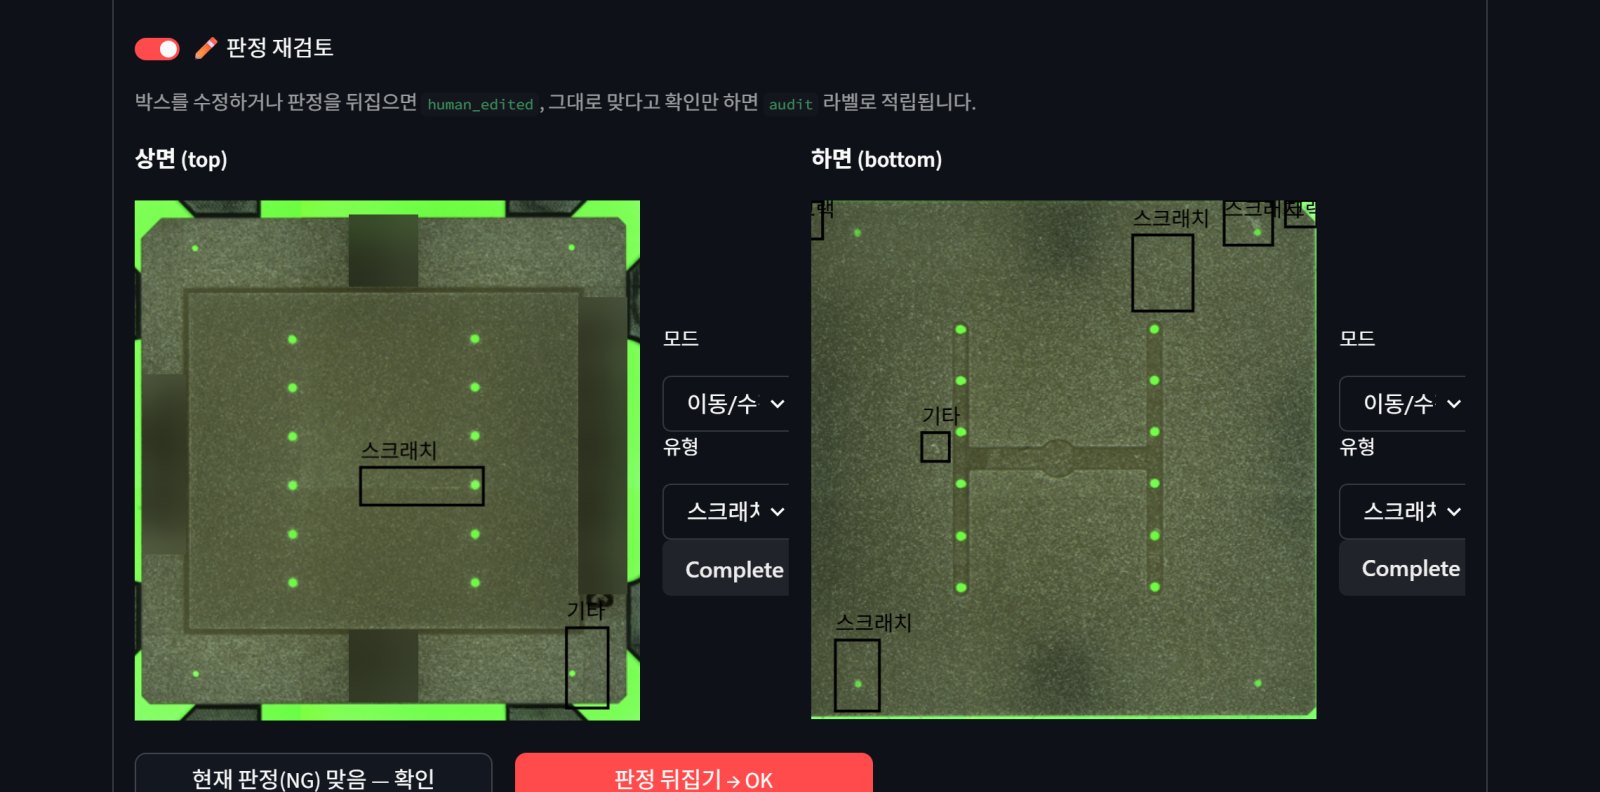
- Images of both faces of every part are picked up automatically, matched to the right lot, and judged.
- The operator only handles the parts the system is unsure about, and every correction becomes a new label for the next training round.
- One workstation with a single GPU on the factory floor, with a web interface the operators use in Korean.
My role
AI consultant and developer. I built it from scratch: data collection and labelling rules on site, the models and their evaluation, the operator application, and the deployment on the factory PC.
The project was selected and funded by a Korean government smart-factory programme for manufacturing AI, and the system is in daily use at the company today.
Earlier work in the same line: sewer defect classification at Veolia Research, where I learned to check the labels before blaming the model.
